Featured Project Walkthrough
Oatly Freight Electrification Model
Executive Summary
This study evaluates the financial and environmental feasibility of electrifying a representative heavy-duty freight fleet over a 5-year horizon. The model integrates emissions accounting, discounted cash flow analysis, fuel price sensitivity, grid carbon intensity modeling, and route prioritization logic to determine when electrification is both operationally viable and financially rational.
Baseline Emissions
308.5
metric tons CO₂ / year
Feasible Route Impact
-27.2%
annual fleet emissions
Combined Financial & Climate Sensitivity
5-Year TCO (NPV @ 8%)
| Scenario | Diesel NPV | EV NPV | EV Advantage |
|---|---|---|---|
| Low Fuel ($3/gal) | $414,214 | $559,720 | −$145,506 |
| Base Case ($4/gal) | $475,559 | $559,720 | −$84,161 |
| High Fuel ($5.50/gal) | $567,300 | $559,720 | +$7,580 |
| EV Incentive ($80k credit) | $475,559 | $479,720 | −$4,161 |
- Under low diesel prices, electrification is materially more expensive.
- Under high fuel price volatility, EV becomes economically favorable.
- Under incentive support, EV approaches cost parity within 5 years.
Grid Carbon Sensitivity
All Routes Electrified
| Grid Case | EV Emissions (tCO₂/yr) | % Change vs Diesel |
|---|---|---|
| Diesel Baseline | 308.50 | — |
| High-Carbon Grid | 315.20 | +2.2% worse |
| U.S. Average Grid | 151.69 | −50.8% |
| E.U. Average Grid | 98.50 | −68.1% |
| Low-Carbon Grid | 39.40 | −87.2% |
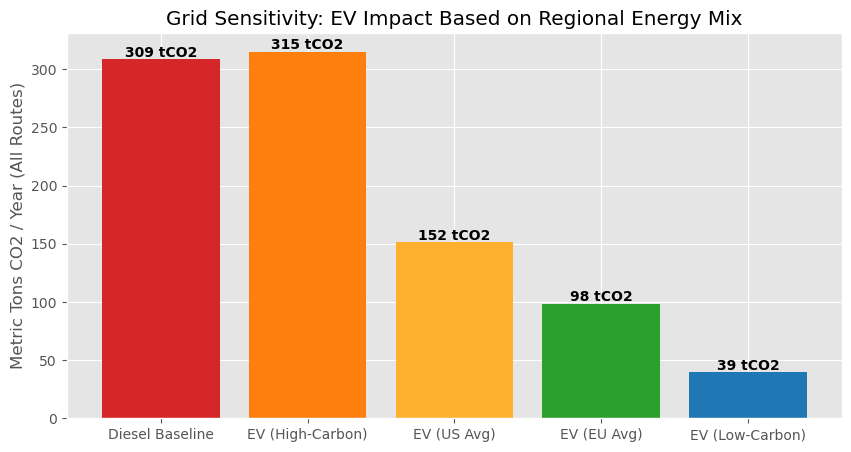
- Under coal-heavy grids, electrification slightly increases emissions.
- Under renewable-heavy grids, emissions reductions are dramatic.
This highlights that transport electrification and grid decarbonization must advance in parallel to maximize climate benefit.
Route Prioritization Framework
Routes were evaluated using:
-
Emissions reduction potential
-
Annual operating cost savings
-
Range feasibility constraint (≤ 250 miles)
Phase 1 Candidates:
Routes R3 and R2
(highest emissions and financial benefit within operational range)
This phased strategy reduces risk while maximizing near-term impact.
Strategic Implications
- Electrification is most rational on short-haul, high-utilization routes.
- Financial feasibility within 5 years is highly sensitive to diesel price volatility.
- Policy incentives materially accelerate parity timelines.
- Grid carbon intensity determines true climate ROI.
- Electrification strategy must be regionally adaptive.
Modeling Assumptions
Limitations
This model uses synthesized route data for demonstration purposes and excludes dynamic payload variation, battery degradation modeling, and advanced tax structuring. It is intended as a strategic decision-support framework rather than a deployment-ready operational model.